Affiliate marketing is changing fast, and data is now a game changer for anyone involved. Finding and tracking the right numbers isn’t just for big companies with fancy dashboards. Even if you’re just starting out or running a small blog with affiliate links, paying attention to data can make campaigns smarter and way more profitable. In this article, I’ll walk through where data fits in, why it matters, and how you can use it to boost your affiliate marketing performance without getting lost in spreadsheets.
Why Data Is the Secret Sauce for Affiliate Marketing
The affiliate marketing world has come a long way from tracking clicks on a single banner ad. Today’s landscape is packed with different traffic sources, offers, and audiences. Brands are relying more on affiliates to get results they can measure. And affiliates? They’re under pressure to deliver results quickly, often with tight budgets. That’s where data really shines. It gives concrete feedback about what’s working and what’s wasting time and money.
Data isn’t just about hunting for the biggest numbers. It provides straight-up answers to questions like: which offers are getting clicks, which sources are actually converting, and when visitors are most likely to buy. The real value of digging into these details is being able to spot patterns, tweak strategies, and keep things efficient.
Gathering data used to mean checking a few graphs at the end of the month. Now, marketers can analyze real time trends and spot issues before they snowball. Thanks to tools like Google Analytics, affiliate dashboards, and even spreadsheets, it’s possible for anyone to track the basics and act on them.
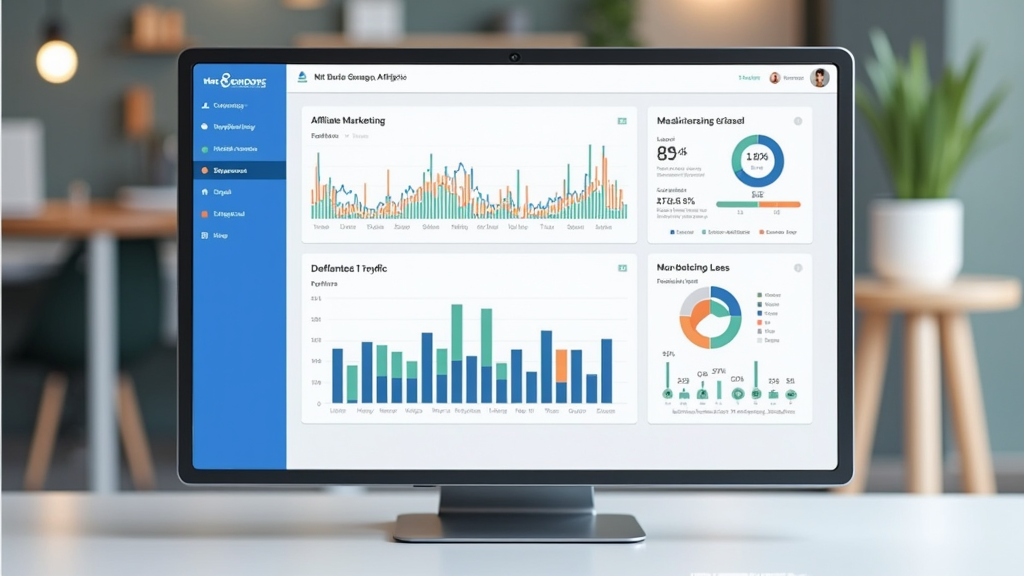
Core Metrics That Matter Most
If you’re just starting out, all the numbers can get overwhelming. Not every metric needs to be tracked, but a few basics consistently offer the most useful insights for boosting affiliate efforts:
- Click Through Rate (CTR): Shows how well your content or creative grabs attention. A higher CTR usually means the ad, banner, or review caught someone’s interest.
- Conversion Rate: Tells you the percentage of visitors who actually complete a desired action, like making a purchase or signing up. It’s the key number for understanding what’s bringing in real results, not just traffic.
- Average Order Value (AOV): The average amount spent per conversion. Knowing this helps you estimate earnings and spot upsell opportunities.
- Return on Investment (ROI): Measures how much money you’re making compared to what you’re spending on ads, content, or tools. If ROI is dropping, it’s time to change things up.
- Traffic Sources: Identifies where your most valuable visitors are coming from, whether that’s SEO, social media, email, or something else.
- Bounce Rate: Shows the percentage of people who leave your page without taking action. High bounce rates can point out irrelevant traffic or weak landing pages.
Getting to grips with these numbers makes it easier to spend budget wisely and figure out where extra effort pays off.
Collecting and Analyzing Affiliate Data Easily
You don’t need to be a data scientist to analyze affiliate data. Most networks, like ShareASale, Rakuten, Amazon Associates, and CJ Affiliate, offer built in dashboards with performance data. Google Analytics also syncs up with pretty much any site, giving you deeper details on where clicks and conversions are coming from.
Some things I’ve found useful for organizing and analyzing data:
- Set up clear tracking links: Tools like Pretty Links or Bitly let you make unique links for each campaign. This makes it easy to see exactly which link or placement is behind the results.
- Segment your traffic: Divide data by location, device, time, and referral source. Trends are easier to spot in smaller, focused groups.
- Automate reports: Many dashboards let you schedule weekly or monthly reports. Having these drop into your inbox saves time and keeps you consistent.
- Use spreadsheet basics: Even a simple Google Sheet can work wonders for tracking trends, noting changes, and planning new tests.
Checking stats daily might sound like overkill, but regular check ins spot problems early. A sudden drop in clicks, for example, could be due to a broken link, or maybe an ad got paused.
Turning Data Into Action: Optimization Tips
Data is only as good as what you do with it. Here’s how I put numbers to work in my own affiliate marketing efforts:
- Test and Tweak: Sometimes a headline change, different call to action, or updated image can improve click through rates dramatically. I try running small A/B tests for emails, banners, or even review layouts to learn what gets attention.
- Double Down on Winners: If a product or content style consistently converts, it’s worth creating more like it or placing these offers more prominently on your site.
- Cut the Dead Weight: High traffic sources with low conversions can drain time. I regularly trim out the weakest channels and focus on where I’m seeing real returns.
- Personalize Offers: If data shows most conversions come from one location or device type, I adjust copy or creatives to fit. For example, mobilefriendly banners when most shoppers use phones.
- Watch for Seasonal Trends: Traffic and buying behavior can switch up by the month, week, or even hour. Using historical data, I plan content and promos around times when people are most interested, like back to school or Black Friday sales.
Small ongoing optimizations, driven by the latest data, easily add up to higher payouts over time.
Common Challenges and How Data Helps Solve Them

Affiliate marketing isn’t always smooth sailing. Problems like ad fraud, shady traffic, and conversion drops can throw a wrench in the works. Data can help spot and fix these issues before they hurt performance:
- Click Fraud: Unusual spikes in clicks from certain IPs or locations could mean bots or fake traffic. Using analytics tools to monitor click sources helps spot these fast.
- Low Conversion Rates: Tons of clicks but few sales often signal a mismatch between the ad message and the landing page. Comparing conversion rates from different sources shows where the disconnect happens.
- Poor Ad Placement: Testing various positions for affiliate links shows which ones feel natural versus those visitors just skim over.
- Seasonal Slumps: If sales crash in certain months, checking last year’s data may provide clues about why, and help with planning fresh promotions or bonuses.
Click Fraud: Why It’s a Headache
Not all clicks are created equal. Robots, click farms, or mischievous competitors can give your stats a fake boost. I recommend regularly checking your raw click data for spikes that don’t match normal behavior. Flag and block suspicious sources whenever possible. Legit networks often help filter out the worst offenders, but an extra set of eyes never hurts.
Bounce Rate and Conversion Drops: Quick Diagnostics
If your bounce rate suddenly jumps or conversions stall, compare new traffic sources to your top performing ones. Sometimes, a traffic source with lots of visitors just isn’t attracting the right kind of buyer. The fix could be as simple as changing copy or targeting a new audience.
How Real Affiliates Put Data to Work
In my experience, the best affiliate marketers treat data as their guide, not just a report card. For example, I once worked with a tech review site that noticed its main audience was night owls shopping between 10pm and 2am. By tweaking email send times and scheduling social posts later in the evening, clicks and sales both went up by 18 percent the following month. That kind of quick win only happened because we paid attention to time of day data and acted on it.
Similarly, travel bloggers often review geolocation data. If bookings spike for certain destinations during holidays, they time new content and fresh banners to match the search patterns. Data isn’t about perfect predictions; it’s about making smarter decisions every day.
- Tech Gadgets: Targeting buyers during major product releases or events, timing posts and ads for when people are most interested.
- Fashion and Lifestyle: Using seasonal trends, like holiday shopping or summer wardrobes, to promote relevant deals when shoppers are most active.
- Finance and SaaS: Segmenting by device and demographics, serving desktop users different offers than mobile users based on historical conversion data.
Frequently Asked Questions
Question: How often should I check my affiliate marketing data?
Answer: I usually check core stats every few days, but run deeper reports at least once a month. More frequent checks help catch sudden changes, while monthly reviews are great for spotting big picture trends.
Question: What’s the best way to start using data for affiliate marketing?
Answer: Start simple by tracking basic metrics like clicks, conversions, and traffic sources. Most affiliate programs have these numbers built in, so you don’t need any advanced tools to get going.
Question: Do I need special tools to analyze affiliate data?
Answer: Not really. Built in dashboards from affiliate networks and basic tools like Google Analytics cover most needs. If you want to get fancy, there are paid analytics platforms, but they aren’t always necessary for small or midsize operations.
Bringing It All Together
Affiliate marketing works best when decisions are based on what’s really going on, not guesses. Even a handful of well tracked numbers can help you spot opportunities for growth and patch up weak spots. Try experimenting with your campaigns, keep your eyes on the numbers, and use each result, good or bad, as a guide for what to do next. There’s always room to learn, and data is your shortcut to smarter, more confident marketing moves. For those looking to get a feel for trends or try new strategies, staying curious and flexible pays off. The competitive edge really comes from turning numbers into action, one insight at a time.